
Spend your time where it matters most
Open Architects data tools allow you to easily view information about your students with special needs and English learners all in one place. Review program placements for your in-district and out-of-district students, IEP requirements, and program costs. Monitor trends for newcomer students and explore performance on your state language acquisition assessments. With our dashboards, you are finally one step ahead in understanding student needs and managing compliance. So you can spend your time where it matters most - serving students and families.
We connect seamlessly to your existing systems and require no additional work. All it takes is an email and we'll be in touch to coordinate the next steps.
GET STARTED
Popular Dashboards
Check out some of our most popular dashboards for supporting students with special needs and English learners.Special Education Program Explorer
View each of your disability program strands and class sizes, by school and grade level, and monitor student performance trends.- Which special education programs have increasing or declining enrollment?
- How many teachers are on special education license waivers?
- How many students with special needs have typically arrived mid-year?
- Are my programs appropriately staffed based on student enrollment and teacher licensure status?
- How are students with special needs performing across programs and over time?
English Learners Program Explorer
View enrollment, attendance, behavior, and assessment data for English learners, and monitor trends over time. Create proactive plans to support newcomer students arriving mid-year.- How are our English learners performing on our state language acquisition assessment?
- What do trends mean for how we can best support our educators and students?
- Which languages do our newcomer students speak, and which schools and grade levels are they attending?
- How do newcomers’ attendance, behavior and assessment data compare with their peers?
- How do other student group characteristics affect English learner performance, such as IEP status and race/ethnicity?
IEP Tracker
Tracks active IEPs, expiring IEPs, and common special education data errors.- How many IEPs will be due soon and are any overdue?
- Do we have any data errors (e.g. mismatched data in our SIS and IEP platform)?
- Are there trends in IEP status by race, grade level, or English learner status?
Our Partner Portal
Access your tools through our Partner Portal that provides a secure dashboard experience for users of all kinds that updates in real time using your existing data. Give district leaders access to all the data and restrict school support staff to their school and student data.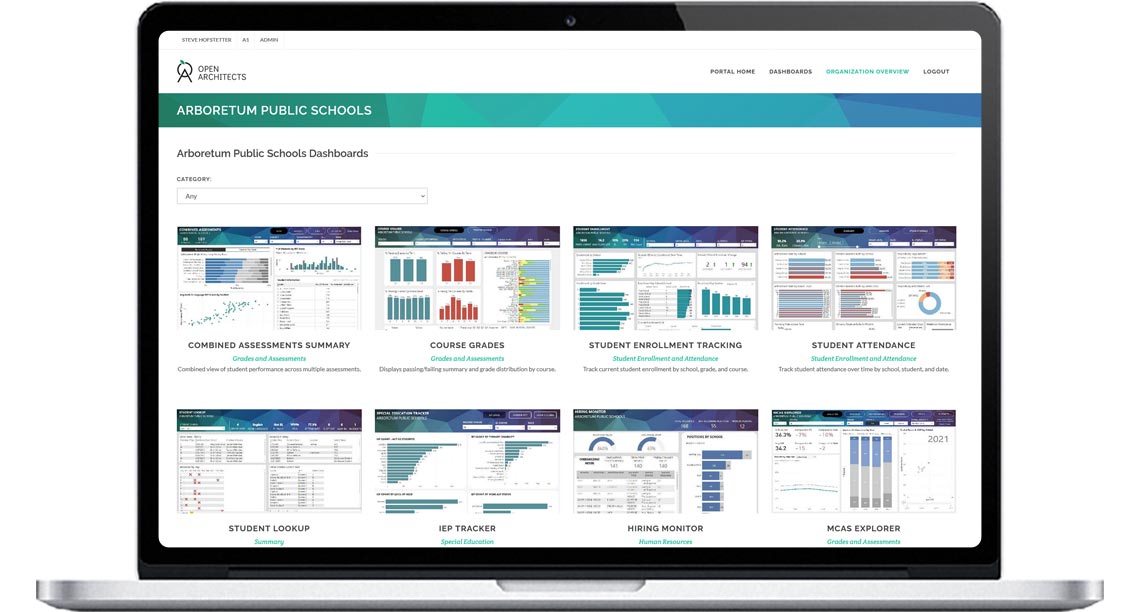
Features
Easy Implementation
We handle the hard part. We use your existing data sources and layer our visuals on top of it; no extra work.
Secure Portal
Your dashboards sit behind a secure portal with custom permissions for district and school staff.
Filter, Slice and Select
Go deeper into your data by applying demographic filters, slicing by school, and selecting date ranges.
Get Connected
We build custom data connectors that link with your data sources and existing platforms. No need to manually upload files or input data into a new system. We handle it all.